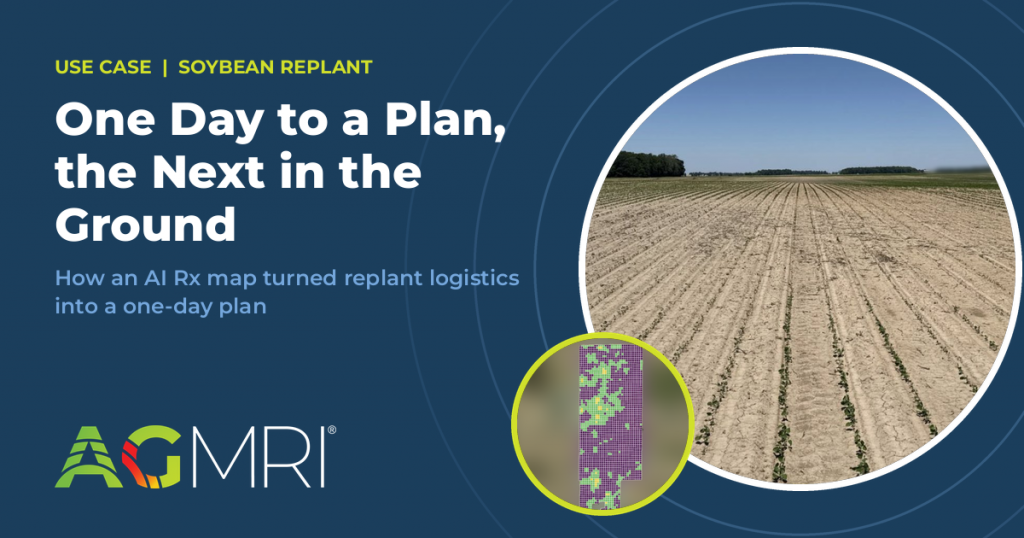

Thin soybean emergence beside an AGMRI AI replant Rx map, with the headline One Day to a Plan, the Next in the Ground
dots-horizontal

Use Case | One Day to a Plan, the Next in the Ground: How an AI Rx Map Sped Up Soybean Replant

Published: October 14, 2026

By: Demitrius Kikalos, Sales Leader

Ask most growers about soybean replant, and they’ll tell you the hard part usually isn’t deciding to do it. It’s everything after: which field to start with, how much seed to order, and which pockets actually need it. When the window is tight, you need those answers fast.

This spring, one of our growers got them in a single day. Here’s how.

A stop-and-start spring
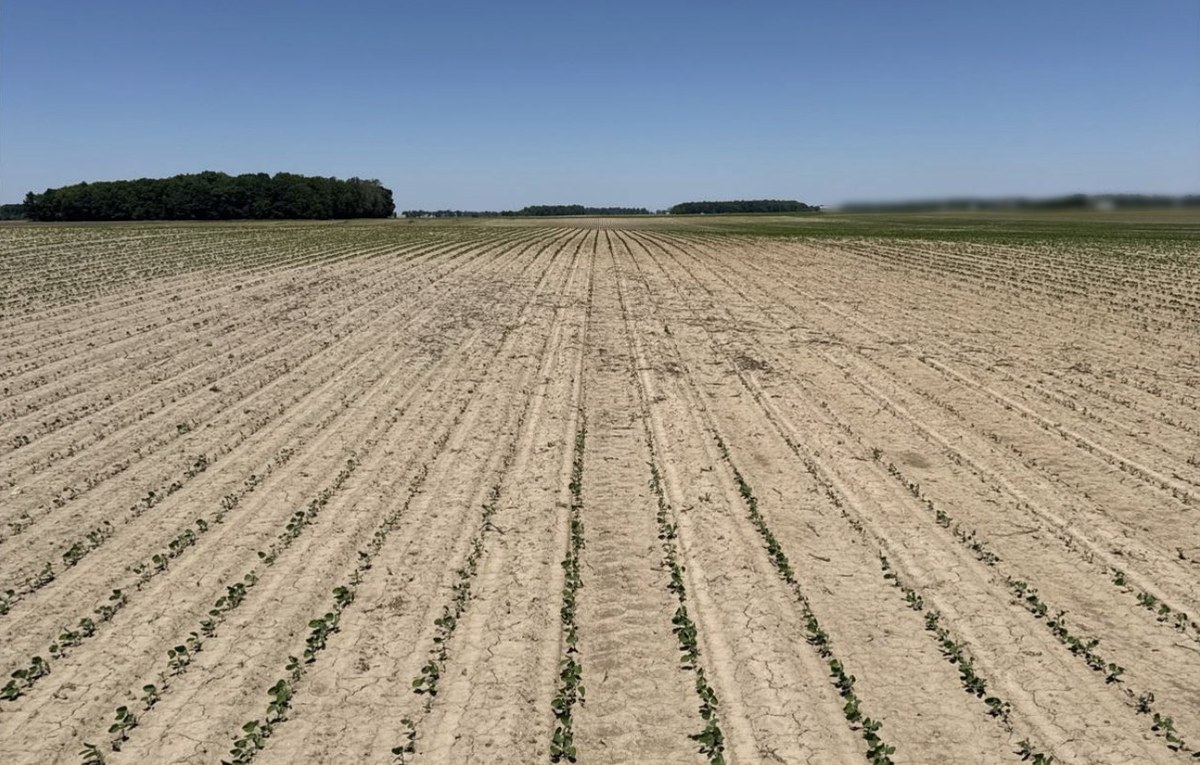
Soybean field with sparse, uneven emergence in dry, cracked soil after a wet spring
Thin, patchy soybean emergence after a wet, stop-and-start spring: acres headed toward near-zero yield without a replant.

This multi-generational operation grows corn and soybeans, built around efficiency: getting the most out of every pass, every acre, and every hour. They plant early most years. And for several springs running, the weather has been wet. 2026 was no exception.

Beans went in early. Then came heavy rain, a stretch of hot weather, and more rain. By the time conditions cooperated, emergence was thin and patchy across several fields, and the window to replant was narrow. Without action, some of those acres were headed toward near-zero yield.

Three replant questions, one tight window

With several fields hit by the same weather, the team needed fast answers to three questions:

  1. Where do we go first?
  2. How much seed do we order?
  3. Which fields and pockets are the priority?

Guess wrong in a tight window, and you burn time driving to the wrong fields, or run short on seed where it matters most.

Ground truth first, then AI

This was the operation’s second season on AGMRI, and they started where good agronomy always starts: on the ground.

The team visited one affected field to build a baseline. They dropped scouting pins and confirmed what the AGMRI imagery showed, so the map patterns matched what was happening in the dirt. Once they knew what a problem pocket looked like in the AGMRI, they could find that same signature across the other affected fields without walking every acre.

Then they gave the scouting and analytics results to the AGMRI AI agent and asked it to generate a replant prescription. After a couple of iterations, they had an acre-level, variable-rate Rx map. It ranked which pockets to replant across a handful of fields and sized the seed order to match.

Diagnose, build the Rx, refine: all of it happened on June 2. The grower replanted the fields on June 3.
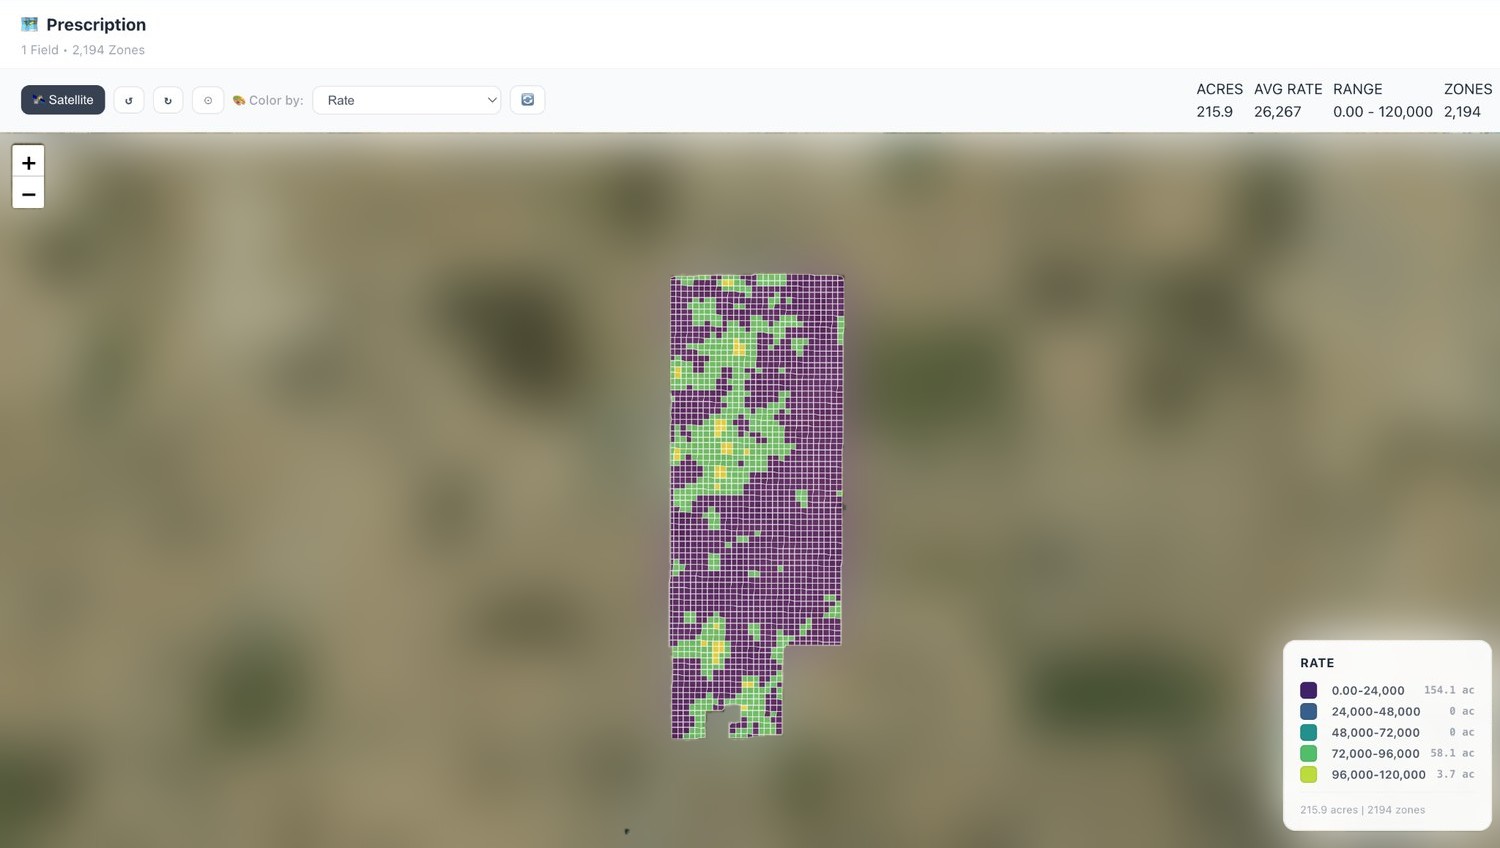
AGMRI variable-rate soybean replant prescription map showing ranked replant pockets across one field
The AI-built replant prescription: an acre-level, variable-rate Rx map that ranked which pockets to replant and sized the seed order.

The results

On one 219-acre field, the plan let the grower spot-replant roughly 60 acres that otherwise would have produced almost nothing.

  • About 60 acres recovered: moved from a projected 0 bu/ac toward a forecast of 60+ bu/ac
  • +16.4 bu/ac: the forecast lift across the whole 219-acre field
  • About $160/ac: recovered opportunity across the field, before input cost

Just as important in a compressed window, the Rx map let the crew work the right acres in the right order and order the right amount of seed, instead of reacting field by field.

What I take from this

The technology didn’t make the call. The grower and the crew did, starting with boots in the field. AGMRI took what they confirmed on the ground and scaled it across every affected acre, fast enough to matter. That’s the job AGMRI is built to do: help good people make good decisions faster.

Frequently Asked Questions

What is a spot replant Rx map?
It's a variable-rate prescription that targets only the pockets of a field that need replanting, rather than the whole field. It also tells you how much seed you need.
How does AGMRI help with soybean replant decisions?
AGMRI imagery and analytics show emergence problems across fields. Once a team confirms on the ground what a problem pocket looks like, the AGMRI AI agent can help build a replant Rx map that ranks pockets and sizes the seed order.
Does this replace scouting?
No. In this case, scouting came first. Ground truth calibrated what the imagery was showing, and the platform extended that knowledge across fields.
How fast can a replant plan come together?
For this operation, the diagnosis, Rx map and refinements were done in one day, and replanting happened the next.

Get your next replant plan in a day

Demitrius Kikalos is Sales Leader for Intelinair.
Share This Article

RELATED BLOG POSTS

[pdf-embedder url=”https://www.intelinair.com/wp-content/uploads/2024/10/Topography-Layer.pdf”

Yield Forecast

Understand where your corn yield is based on the current state of the crop. As the season unfolds, see how it is having an impact on your final yield.

Yield Loss

Powered by years of Nitrogen research at the University of Missouri, our corn Yield Loss analytic, powered by NVision Ag, gives insight into potential yield loss due to Nitrogen deficiency. Optional analytic for nitrogen management.

Variable Dry Down

variable dry down

Understand which fields and which areas of the field are drying down to help plan your harvest logistics.

Underperforming Area

low crop health

Not all areas of your fields perform the same and low NDVI doesn’t necessarily mean there is anything you can do to fix it this year. Underperforming Area alerts you to the fields and areas of the fields that are performing below their historical potential. This will allow you to quickly find those fields and areas and make adjustments to get them back on target and protect yield.

Nutrient Deficiency

nutrient deficiency

As the crop grows, it can tell us more of what is wrong with it. This analytic finds the fields and areas of the fields where there is a nutrient deficiency so that issues can be addressed before grain fill.

Disease Stress

disease risk

In conjunction with the Thermal Stress, Disease Stress alert takes into account weather information to more precisely indicate the type of stress impacting the crop.

Thermal Stress

thermal risk

Using our thermal imagery, AGMRI can detect elevated heat patterns of the crop that indicate crop stress.

Crop Health

Crop Health

Get a complete view of your farms and fields and identify where yield potential is ranked highest to the lowest.

Weed Map & Weed Escape

weed escape

Know what fields and areas of the fields have weeds. With machine integration or based on planting date, be alerted to what fields have weeds that may be impacting yield.

Historical Field Performance

AGMRI creates 5 performance zones in each field based on the historical average of those zones. This data is used to compare the current season to help understand where you are underperforming from the zone potential.

Low Emergence

low emergence

Notification of what fields and areas of the field have poor emergence.

Stand Assessment

strand assessment

AGMRI detects the established rows and uses computer vision and machine learning to determine the best segment of row and compares the rest of the field to that segment to give you a relative map. If machine data is integrated, a stand population map is returned.

YOUR MESSAGE WAS SENT SUCCESSFULLY!

dots-horizontal

We have received your inquiry and we’ll be in touch with you soon. 

Thank you for contacting us.