
Published: October 28, 2026
By: Damon Oien
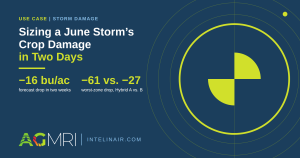
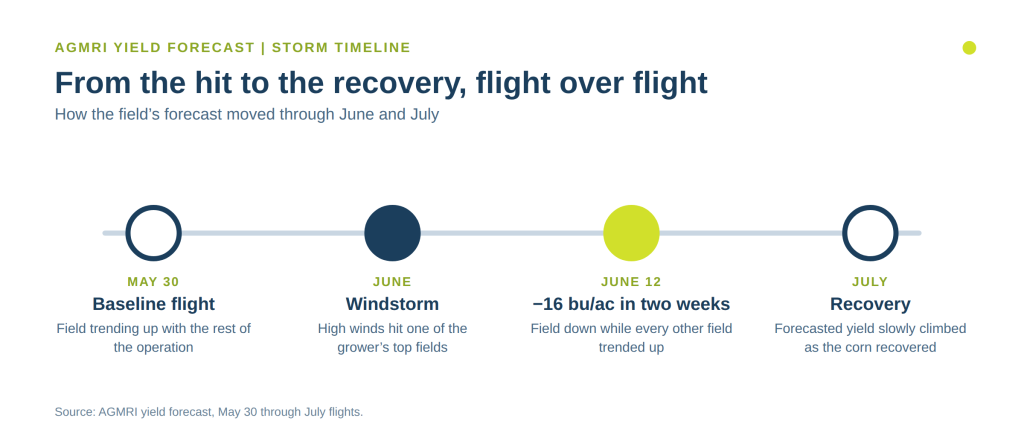
When a storm hits midseason, growers face the same question: how much did it cost, and where? On one operation this June, AGMRI yield forecast answered it within two days of the storm. One field dropped 16 bu/ac in forecasted yield over two weeks while every other field trended up. The data also showed which of the two hybrids took the wind harder, giving the grower numbers to start an insurance claim and a plan for disease monitoring. Then, flight over flight, it tracked the corn’s recovery as forecasted yield slowly climbed through July.
A strong field in a hard season
This grower farms across a wide geography that saw several strong storms in a single month.
Early saturation forced replanting on many acres, and he spent much of his time evaluating those acres and establishing a solid stand.
This field was different. It was one of his later-planted, higher-performing fields, and it trended positively all year.
The question after the storm
After the high winds passed, the team met with the grower for a midseason review. He suspected one of his top fields had taken wind damage, but he hadn’t verified it. Walking the field would have taken time he didn’t have.
Even a field walk would have left the bigger questions open:
- How large was the loss?
- Did one hybrid hold up better than the other?
- Was there enough evidence to support an insurance claim?
What yield forecast showed
The team pulled the AGMRI yield forecast from recent flights. Every other field in the operation was trending up. This one had fallen 16 bu/ac in forecasted yield over two weeks, with the drop lining up with the storms that hit two days before the review.
Next, the grower wanted to know whether one hybrid held up better than the other. The vegetative analytic layer from the June 12 flight showed one hybrid holding a visibly stronger canopy across the field.
Comparing hybrids with AGMRI AI Chat
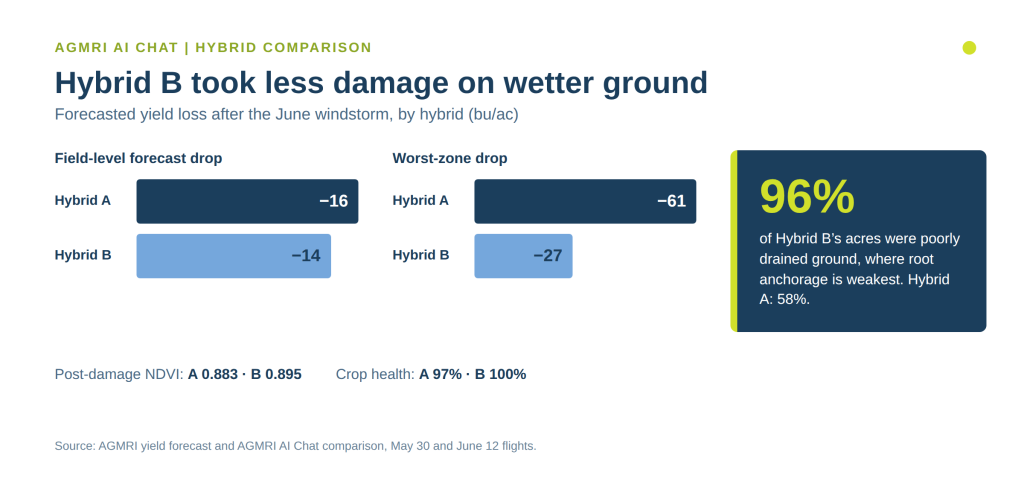
The team then used AGMRI AI Chat to compare the two hybrid environments and see how crop stress and vegetation changed since earlier flights. One hybrid had already fallen behind on that farm and sustained more damage in the high winds.
| Measure (after the wind) | Hybrid A | Hybrid B |
|---|---|---|
| Yield forecast drop (bu/ac) | −16 | −14 |
| Worst zone drop (bu/ac) | −61 | −27 |
| Post-damage NDVI | 0.883 | 0.895 |
| Crop health | 97% | 100% |
| Share of acres poorly drained | 58% | 96% |
Source: AGMRI yield forecast and AGMRI AI Chat comparison, May 30 and June 12 flights.
The drainage figure is the standout. Hybrid B held up better on ground that was 96% poorly drained. Saturated soil weakens root anchorage, yet Hybrid B still outperformed Hybrid A, which sat on better soil.
The management decisions that followed
The grower made two calls from the data:
- Start the insurance claim sooner. He opened claim discussions with field- and hybrid-level numbers in hand, not estimates.
- Watch the damaged acres for disease. Plant damage raises disease risk, so he closely monitored this field as the season moved into peak disease pressure.
The hybrid comparison also gave him evidence for hybrid placement on wet ground in future seasons.
Tracking the recovery
The story didn’t end with the initial hit. The corn recovered significantly from the early wind event, and forecasted yield slowly climbed through July.
Tracking that recovery flight-to-flight gave the grower a truer read on what the storm cost than the initial drop alone. That fuller picture informed both the claim discussions and how closely he managed the field for the rest of the season.
Why timing matters
The value here was speed and specificity. The damage was quantified within days of the storm, down to which hybrid took the worst hit, and the recovery was tracked flight over flight, without waiting until harvest. That timing put evidence behind the claim while it was still fresh and pointed scouting time at the acres most at risk.
AGMRI flags where to look and sizes what it finds. The grower and his advisors make the call.
Frequently Asked Questions
Can yield forecast show storm damage before harvest?
Can aerial imagery compare how hybrids handled wind?
Can yield forecast track how a field recovers after a storm?
How can this data support an insurance claim?
Why monitor storm-damaged fields for disease?
Size your next storm’s damage in days, not at harvest
Damon Oien is a territory account manager at Intelinair.