

Published: August 25, 2026
By: Jake Juarez
If you’ve run a combine, you know the feeling. You’re standing at the edge of a field trying to decide which corn to cut first: this field, or the one three miles down the road. You know where your moisture stands right now. What you don’t know is where it’s headed.
That’s the gap Harvest Moisture Prediction is built to close.
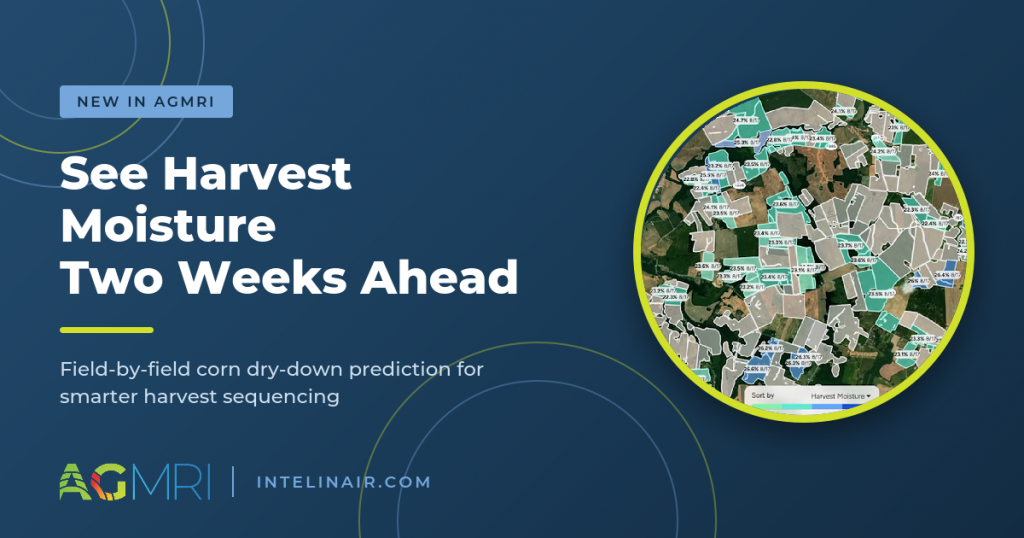
Harvest Moisture Prediction is an AGMRI feature that forecasts corn grain moisture through harvest, field by field, roughly two weeks ahead. As each field reaches maturity, AGMRI predicts where its moisture is headed, so growers can see which fields are on track to be ready when, sequence harvest with confidence, and stop guessing at the year’s most expensive decision point.
The problem: harvest sequencing
Today, most harvest sequencing comes down to what looks ready and which corner of the farm the crew happens to be closest to. That guesswork has a real cost, and it shows up in three familiar ways:
- Drying fees on grain brought in too wet.
- Yield left in the field – kernel shatter, ear drop, and lodging when a field sits too long waiting its turn.
- Missed contract premiums when there’s no confident way to promise which fields will hit target moisture by a delivery date.
A field-level corn moisture forecast replaces that guess with a daily, field-by-field prediction that looks roughly two weeks ahead, turning your call into a data-backed plan.
From “what is” to “what will be”
Harvest Moisture Prediction is a forecast, not just a spot reading: it doesn’t replace your meter; it tells you what your meter won’t: where each field is trending over the next two weeks.
Coverage builds through the season, with more fields joining the forecast as they reach maturity.
How it shows up in AGMRI
Harvest Moisture Prediction lives right inside the tools you already use; no new login, no extra spreadsheet.
- A dry-down curve on the field card. Every mature corn field gets its own curve showing where moisture has been and where it’s predicted to go, with a roughly two-week forecast ahead. Each field carries a clear status: Low Moisture (<18%), Mid-low Moisture (18-22%), Mid-high Moisture (22-25%), or High Moisture (25%+), so you can see at a glance which fields have reached the ≤25% ready-to-cut range.
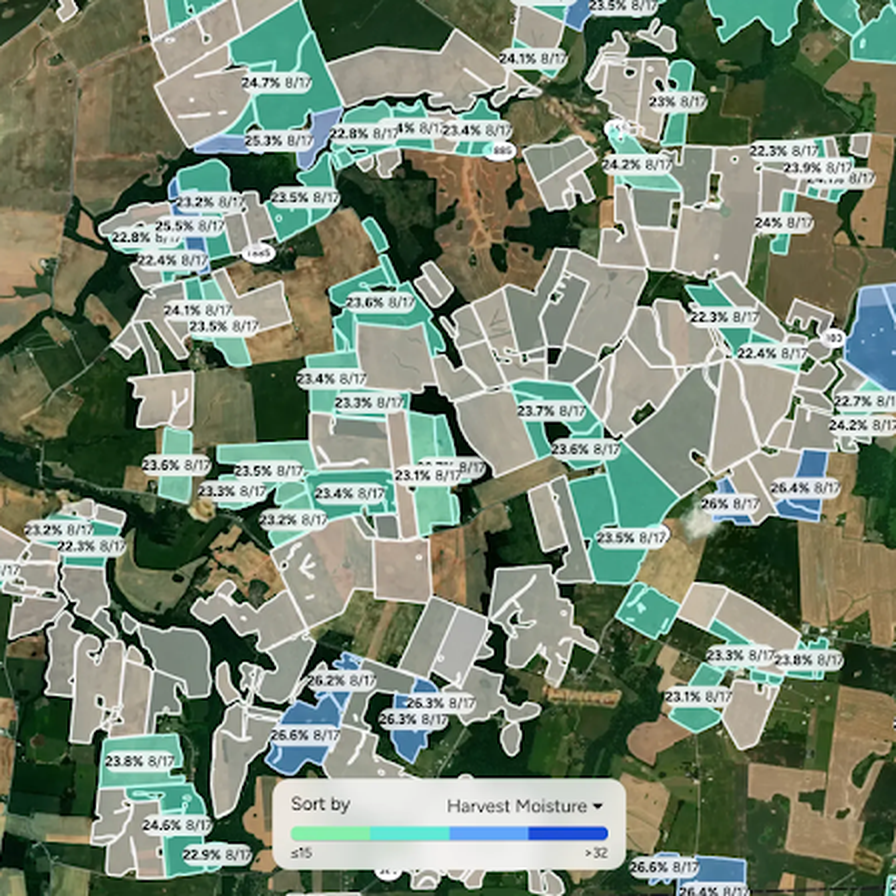
- A whole-farm map view. As fields mature, the map colors them by predicted moisture status, so you can prioritize which ready and drying fields to harvest—the foundation of a smarter harvest route.
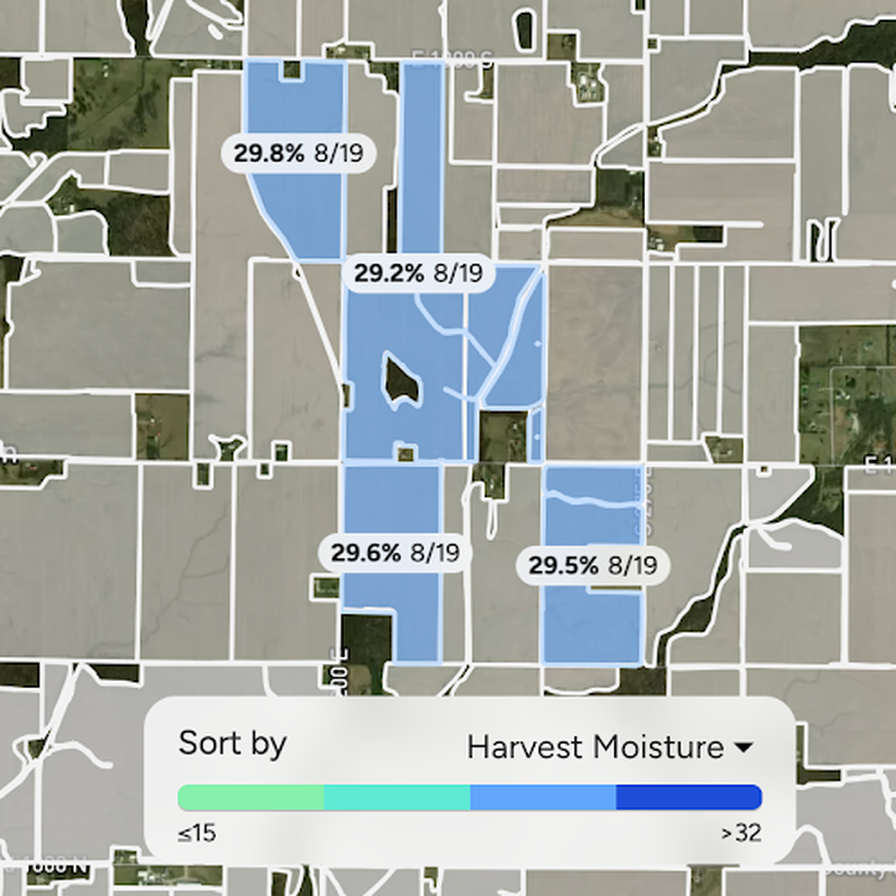
- Built into the AGMRI AI Assistant. Just ask: “Which fields are on track to be ready in the next two weeks?” and get an answer without hunting through screens.
Why field-by-field matters
Every other moisture tool tells you the present status. This one forecasts. And it doesn’t collapse your whole operation into a single number. It’s a separate, predicted dry-down curve for each mature corn field, mapped across the farm, so the plan reflects the real variation between your fields.
What this unlocks
Picture two moments this changes.
- The confident schedule. You get a comparison: harvest this field a few days later than planned, and the extra dry-down could save on propane with minimal added risk. The platform runs it for you.
- The confident contract conversation. Instead of an estimate, you have a model-backed forecast showing how bushels across a particular field is tracking toward target moisture by a specific date.
Who it’s for
Harvest Moisture Prediction is built for the moments when harvest sequencing gets complicated:
- Large growers running multiple harvest crews, where every day of drying costs money.
- Contract-marketing growers who sell forward and need real data behind a delivery-date commitment.
- Ag retailers and cooperative agronomists looking to have a sharper, more valuable conversation with the growers they serve.
Jake Juarez is the Product Lead for Intelinair.
Frequently asked questions
What is Harvest Moisture Prediction?
It's a feature built into AGMRI that forecasts corn grain moisture through harvest, field by field, roughly two weeks ahead, so growers can see which fields are on track to reach the ≤25% ready-to-cut range and plan harvest sequencing around a forecast instead of a guess.
How far ahead does the forecast look?
The dry-down curve on each field card shows a rolling forecast of roughly two weeks. It's not an open-ended prediction for any future date—it's tuned to the near-term window that drives harvest-day decisions.
What do the field statuses mean?
Each corn field carries a moisture status: Low Moisture (<18%), Mid-low Moisture (18–22%), Mid-high Moisture (22–25%), or High Moisture (25%+), so you can see at a glance which fields have reached the ≤25% ready-to-cut range.
How accurate is the forecast?
Harvest Moisture Prediction runs on a hybrid model that combines physics-based dry-down modeling with machine learning, tuned specifically for corn. As with any forecast, treat it as directional. A field is on track to reach the ready-to-cut range, not guaranteed to hit an exact date.
Does it work for soybeans or other crops?
Not yet. Harvest Moisture Prediction is available for corn this season.
Where do I access it?
It's built directly into the AGMRI web platform, on the field card and the whole-farm map, and through the AGMRI assistant. No separate app or spreadsheet required. Check out this Scribe to learn more.
Available now, for corn
Harvest Moisture Prediction is live in AGMRI for corn this season, with coverage expanding to more fields as the season progresses. As always, treat the forecast as directional guidance for planning, not a guaranteed outcome.
Want to see it in action? Log into AGMRI to check the dry-down curve on your own fields, or ask the AI Agent which fields are coming up next.