
dots-horizontal

Intelinair Participating in 2026 WHIN Ag Summit

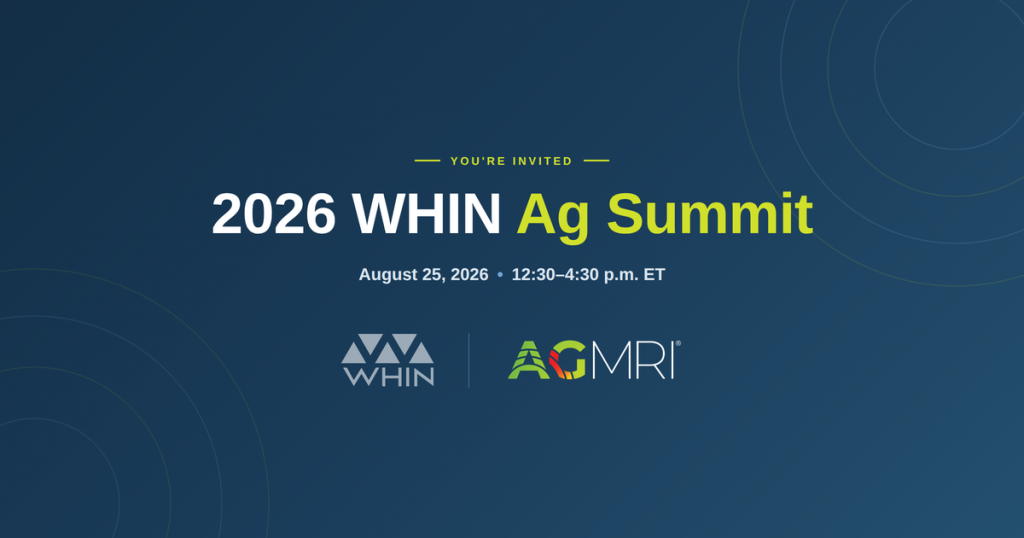
Intelinair is heading to West Lafayette, Indiana, this August for the 2026 WHIN Ag Summit, hosted by the Wabash Heartland Innovation Network (WHIN). We’ll be participating in the Expo, where our team will share the latest AGMRI features and capabilities that support management decision-making through the season and beyond.

The WHIN Ag Summit brings together growers, ag retailers, technology providers, and researchers to explore how digital agriculture tools are being evaluated, adopted, and put to work on real farms across the Wabash Heartland region. It’s a great opportunity to connect with the people shaping the future of ag innovation in Indiana and beyond.

If you’re attending, stop by our booth during the Technology Showcase to see AGMRI in action and talk with Demitrius Kikalos, Sales Leader, and Blake Retherford, Territory Account Manager, about how in-season crop intelligence can strengthen the decisions you and your agronomist make every day.

2026 WHIN Ag Summit

Event Details

2026 WHIN Ag Summit

August 25 · 12:30–4:30 p.m. ET
Beck Agricultural Center · West Lafayette, Indiana

Schedule at a Glance

  1. Registration & Networking
  2. Welcome & The State of Ag Innovation
  3. How WHIN Evaluates New Technologies
    • Founder interviews
    • Customer feedback
    • Farmer member interviews
  4. Technology Showcase & Booth Visits
  5. From On-Farm Pilots to Trusted Tech Partners

Join Us

Spend an afternoon with the people testing, proving, and scaling the next generation of ag technology.

Register for the Ag Summit Learn more about WHIN

We hope to see you in West Lafayette!

Share This Article

RELATED BLOG POSTS

[pdf-embedder url=”https://www.intelinair.com/wp-content/uploads/2024/10/Topography-Layer.pdf”

Yield Forecast

Understand where your corn yield is based on the current state of the crop. As the season unfolds, see how it is having an impact on your final yield.

Yield Loss

Powered by years of Nitrogen research at the University of Missouri, our corn Yield Loss analytic, powered by NVision Ag, gives insight into potential yield loss due to Nitrogen deficiency. Optional analytic for nitrogen management.

Variable Dry Down

variable dry down

Understand which fields and which areas of the field are drying down to help plan your harvest logistics.

Underperforming Area

low crop health

Not all areas of your fields perform the same and low NDVI doesn’t necessarily mean there is anything you can do to fix it this year. Underperforming Area alerts you to the fields and areas of the fields that are performing below their historical potential. This will allow you to quickly find those fields and areas and make adjustments to get them back on target and protect yield.

Nutrient Deficiency

nutrient deficiency

As the crop grows, it can tell us more of what is wrong with it. This analytic finds the fields and areas of the fields where there is a nutrient deficiency so that issues can be addressed before grain fill.

Disease Stress

disease risk

In conjunction with the Thermal Stress, Disease Stress alert takes into account weather information to more precisely indicate the type of stress impacting the crop.

Thermal Stress

thermal risk

Using our thermal imagery, AGMRI can detect elevated heat patterns of the crop that indicate crop stress.

Crop Health

Crop Health

Get a complete view of your farms and fields and identify where yield potential is ranked highest to the lowest.

Weed Map & Weed Escape

weed escape

Know what fields and areas of the fields have weeds. With machine integration or based on planting date, be alerted to what fields have weeds that may be impacting yield.

Historical Field Performance

AGMRI creates 5 performance zones in each field based on the historical average of those zones. This data is used to compare the current season to help understand where you are underperforming from the zone potential.

Low Emergence

low emergence

Notification of what fields and areas of the field have poor emergence.

Stand Assessment

strand assessment

AGMRI detects the established rows and uses computer vision and machine learning to determine the best segment of row and compares the rest of the field to that segment to give you a relative map. If machine data is integrated, a stand population map is returned.

YOUR MESSAGE WAS SENT SUCCESSFULLY!

dots-horizontal

We have received your inquiry and we’ll be in touch with you soon

Thank you for contacting us.