Use Case: Predictive Disease Finds Indiana’s First Tar Spot
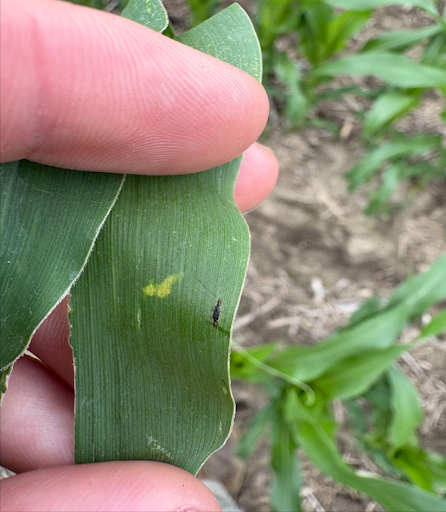
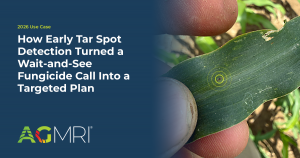
Ground-truth confirmation: an early tar spot lesion—a small dark stroma ringed in yellow—easy to walk right past on a single leaf.
Background
AGMRI Predictive Disease flagged the season’s first confirmed tar spot in Indiana in early June, then narrowed roughly 90 at-risk fields into a scouting filter that uncovered the disease in five more counties—giving crop consultants a head start. Difficult weather at planting—cold and wet—led to rough emergence and reduced plant health across the region: the kind of stressed start that can set corn up for disease. It set the stage for something nobody expected this early— the first confirmed case of tar spot in Indiana. Tar spot is rarely on anyone’s radar in early June; in a typical year it isn’t found until late in the month, which made an early-June confirmation genuinely unusual.
Challenge
Finding tar spot early is hard. The first signs are tiny lesions on only a handful of plants, easy to miss—and no one can put scouts in every field checking every leaf. In a year when stressed corn and unusual weather raised the risk, the disease could establish and start spreading before anyone confirmed it was present, and once it’s spreading, the window closes fast (tar spot can cost on the order of 35 bu/ac in a bad year). The real challenge was knowing where to look—early, before the calendar said tar spot should be a concern.
Instead of checking every leaf in every field, Predictive Disease pointed scouts straight to the acres most likely to have tar spot.
Solution
Predictive Disease answered the hardest question first: where to look. Rather than blanket scouting, it produced a list of roughly 90 fields across Indiana where the combination of weather, hybrid, and tillage made conditions conducive to tar spot spore growth.
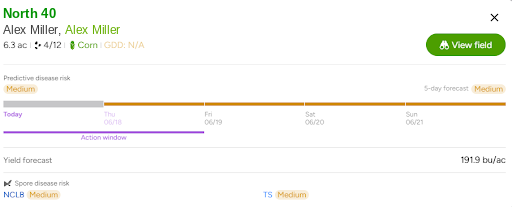
A Predictive Disease field card: weather, hybrid, and tillage combine into a medium tar-spot risk with a defined action window—one of roughly 90 fields flagged statewide.
That list pointed scouts at the highest-risk fields first—and it’s how the season’s first confirmed Indiana case was found on June 9, in a single field the model flagged. The find didn’t just confirm one case; it validated the model and turned a list of at-risk fields into a working scouting plan for the rest of the season. The platform surfaced where to look; the scouting call and confirmation stayed with the agronomy team.
Results
Building on that first find, the crop consultants used Predictive Disease as a filter for scouting. Working from the list of at-risk fields, they confirmed tar spot in five additional counties—early. That head start mattered: it let consultants get ahead of disease-containment conversations with their growers rather than reacting after the disease had already taken hold. With the model validated by an early-season confirmation, the team can keep focusing limited boots-on-the-ground time on the fields most likely to need it.
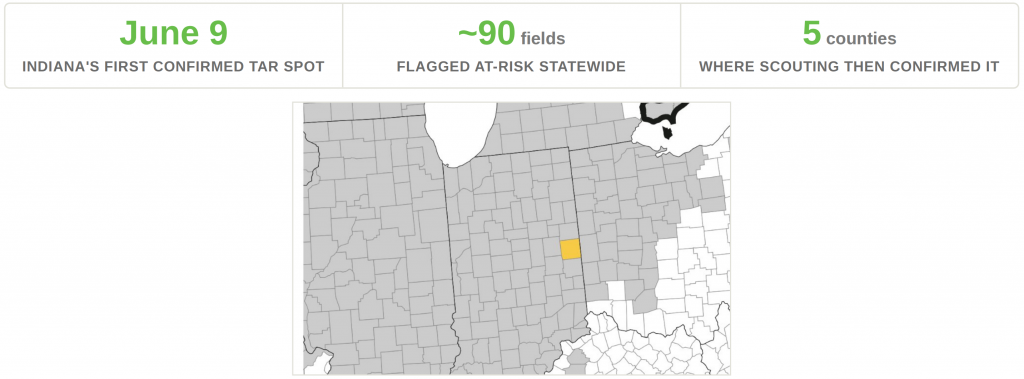
Crop Protection Network tar spot map (June 10): the single
orange county marks this season's first confirmed positive in the Midwest.
Understand where your corn yield is based on the current state of the crop. As the season unfolds, see how it is having an impact on your final yield.
Yield Loss
Powered by years of Nitrogen research at the University of Missouri, our corn Yield Loss analytic, powered by NVision Ag, gives insight into potential yield loss due to Nitrogen deficiency. Optional analytic for nitrogen management.
Variable Dry Down
Understand which fields and which areas of the field are drying down to help plan your harvest logistics.
Underperforming Area
Not all areas of your fields perform the same and low NDVI doesn’t necessarily mean there is anything you can do to fix it this year. Underperforming Area alerts you to the fields and areas of the fields that are performing below their historical potential. This will allow you to quickly find those fields and areas and make adjustments to get them back on target and protect yield.
Nutrient Deficiency
As the crop grows, it can tell us more of what is wrong with it. This analytic finds the fields and areas of the fields where there is a nutrient deficiency so that issues can be addressed before grain fill.
Disease Stress
In conjunction with the Thermal Stress, Disease Stress alert takes into account weather information to more precisely indicate the type of stress impacting the crop.
Thermal Stress
Using our thermal imagery, AGMRI can detect elevated heat patterns of the crop that indicate crop stress.
Crop Health
Get a complete view of your farms and fields and identify where yield potential is ranked highest to the lowest.
Weed Map & Weed Escape
Know what fields and areas of the fields have weeds. With machine integration or based on planting date, be alerted to what fields have weeds that may be impacting yield.
Historical Field Performance
AGMRI creates 5 performance zones in each field based on the historical average of those zones. This data is used to compare the current season to help understand where you are underperforming from the zone potential.
Low Emergence
Notification of what fields and areas of the field have poor emergence.
Stand Assessment
AGMRI detects the established rows and uses computer vision and machine learning to determine the best segment of row and compares the rest of the field to that segment to give you a relative map. If machine data is integrated, a stand population map is returned.
YOUR MESSAGE WAS SENT SUCCESSFULLY!
We have received your inquiry and we’ll be in touch with you soon.