Use Case: A Whole-Farm V5 Fungicide Decision — Made in a Day, Not a Month
A corn and soybean grower used AGMRI to turn a full season of cold-stress and weather data into a same-day, field-by-field fungicide plan, and protected yield ahead of a severe local tar spot outbreak.
Key Takeaways
Decision-ready in a day, not a month. AGMRI compiled the season’s weather and crop-stress history so he could decide where to spray inside a one-day window — not weeks later.
Field-by-field risk, not a blanket call. The report ranked each field by cold-day exposure with a clear spray / no-spray recommendation and an ROI estimate net of application cost.
Protected yield, ahead of disease. The treated field carried zero disease pressure while nearby fields developed severe tar spot — a forecast gain of 18+ bushels per acre.
Background
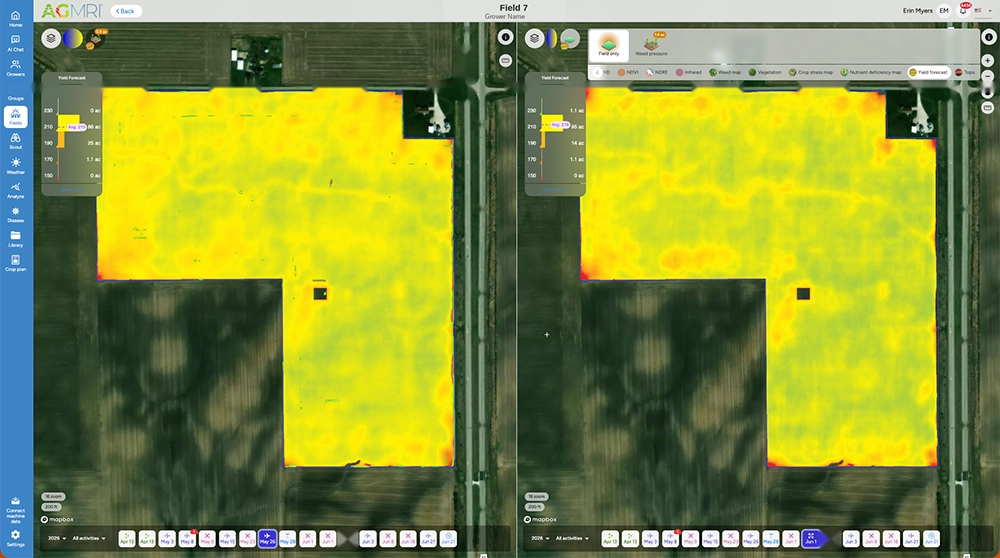
Side-by-side yield forecast maps show a 3 bu/ac increase immediately following fungicide application.
Like many farms this season, this corn and soybean operation was wet and cold early. Rough conditions after planting put uneven stress on the stand and raised the risk of disease later in the year. The grower already planned a V5 fungicide pass on some fields — the open question was whether the rest of the farm needed it too.
Challenge
A cold, wet start doesn’t hit every field the same way, and that’s exactly what made the decision hard. He wanted to treat the fields that needed it — and not spend on the ones that didn’t — but he couldn’t see the difference from the cab.
To make the call well, he’d have to reconstruct each field’s weather and stress history: how many cold days each one took, how much precipitation, and what that meant for crop stress and disease risk going into the season. Compiling and interpreting that by hand across the whole operation is roughly a month of work. His window was one day:
“How can I map all the previous weather and then make a V5 fungicide decision based on crop stress and risk — without it taking me a month to compile the data? I need to spray it tomorrow.”
If he guessed, he risked one of two costly outcomes: over-applying on fields that didn’t need it, or skipping a field that was quietly at risk and paying for it later in disease pressure and lost yield.
Solution
AGMRI tracks weather and crop conditions for every field from planting through harvest. Its AI tool pulled that history together quickly, flagging when plants were at risk based on temperature exposure and precipitation — the same legwork that would have taken weeks by hand.
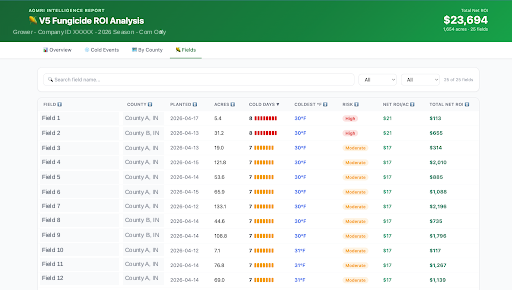
AI-generated report showing field-level risk (high, moderate, low), used to inform fungicide application decisions.
From that data, a standard report covered every field on the farm. For each one it showed the number of cold days, a clear recommendation to spray or not, and a proposed ROI that accounted for the cost of application. Instead of a month of spreadsheet work, he had a field-by-field read the same day — in time to act inside his window.
The platform did the compiling and surfaced the risk; the agronomic decision stayed with the grower.
Results
With a clear, field-by-field picture in hand, he moved ahead with V5 fungicide applications across the operation.
One field shows the payoff. It came back as moderate risk with a recommendation to spray, and he treated it on May 28. By June 1, its yield forecast had already ticked up about 3 bushels from the May 26 reading — and it kept climbing, reaching a forecast of 236 bushels per acre, an 18-bushel increase. Just as important, the field carried zero disease pressure while other fields in the same area developed severe tar spot. In a season like this one, that difference could be worth 18+ bushels to the acre.
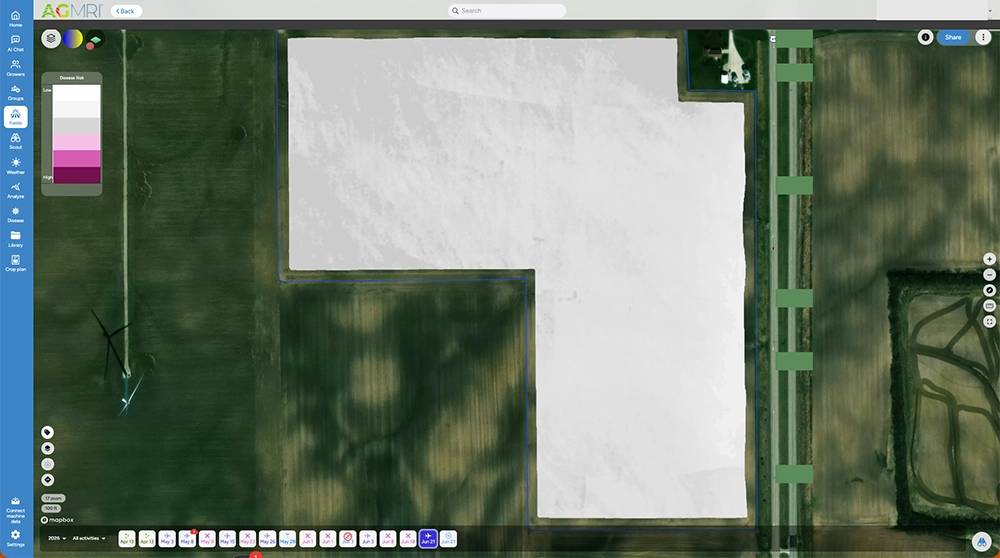
Zero disease risk detected as of June 21, and yield forecasts climbed 18 bushels.
Understand where your corn yield is based on the current state of the crop. As the season unfolds, see how it is having an impact on your final yield.
Yield Loss
Powered by years of Nitrogen research at the University of Missouri, our corn Yield Loss analytic, powered by NVision Ag, gives insight into potential yield loss due to Nitrogen deficiency. Optional analytic for nitrogen management.
Variable Dry Down
Understand which fields and which areas of the field are drying down to help plan your harvest logistics.
Underperforming Area
Not all areas of your fields perform the same and low NDVI doesn’t necessarily mean there is anything you can do to fix it this year. Underperforming Area alerts you to the fields and areas of the fields that are performing below their historical potential. This will allow you to quickly find those fields and areas and make adjustments to get them back on target and protect yield.
Nutrient Deficiency
As the crop grows, it can tell us more of what is wrong with it. This analytic finds the fields and areas of the fields where there is a nutrient deficiency so that issues can be addressed before grain fill.
Disease Stress
In conjunction with the Thermal Stress, Disease Stress alert takes into account weather information to more precisely indicate the type of stress impacting the crop.
Thermal Stress
Using our thermal imagery, AGMRI can detect elevated heat patterns of the crop that indicate crop stress.
Crop Health
Get a complete view of your farms and fields and identify where yield potential is ranked highest to the lowest.
Weed Map & Weed Escape
Know what fields and areas of the fields have weeds. With machine integration or based on planting date, be alerted to what fields have weeds that may be impacting yield.
Historical Field Performance
AGMRI creates 5 performance zones in each field based on the historical average of those zones. This data is used to compare the current season to help understand where you are underperforming from the zone potential.
Low Emergence
Notification of what fields and areas of the field have poor emergence.
Stand Assessment
AGMRI detects the established rows and uses computer vision and machine learning to determine the best segment of row and compares the rest of the field to that segment to give you a relative map. If machine data is integrated, a stand population map is returned.
YOUR MESSAGE WAS SENT SUCCESSFULLY!
We have received your inquiry and we’ll be in touch with you soon.