Author: Erin Myers

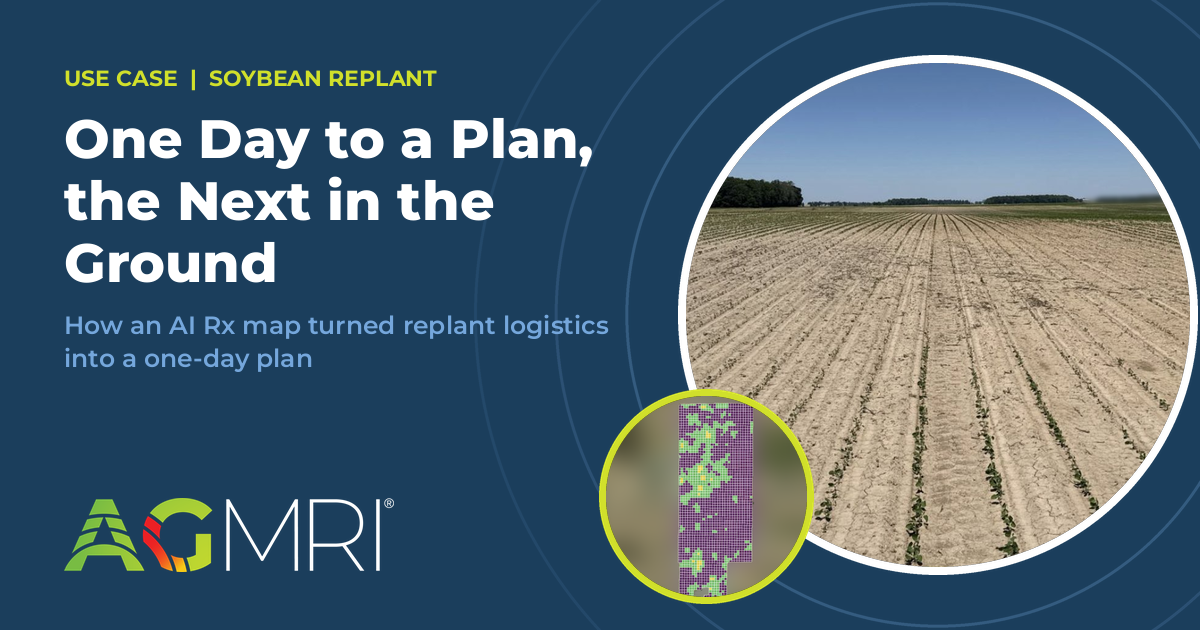
  • Use Case | One Day to a Plan, the Next in the Ground: How an AI Rx Map Sped Up Soybean Replant

    Use Case | One Day to a Plan, the Next in the Ground: How an AI Rx Map Sped Up Soybean Replant

    Published: October 14, 2026

    By: Demitrius Kikalos, Sales Leader

    Ask most growers about soybean replant, and they’ll tell you the hard part usually isn’t deciding to do it. It’s everything after: which field to start with, how much seed to order, and which pockets actually need it. When the window is tight, you need those answers fast.

    This spring, one of our growers got them in a single day. Here’s how.

    A stop-and-start spring
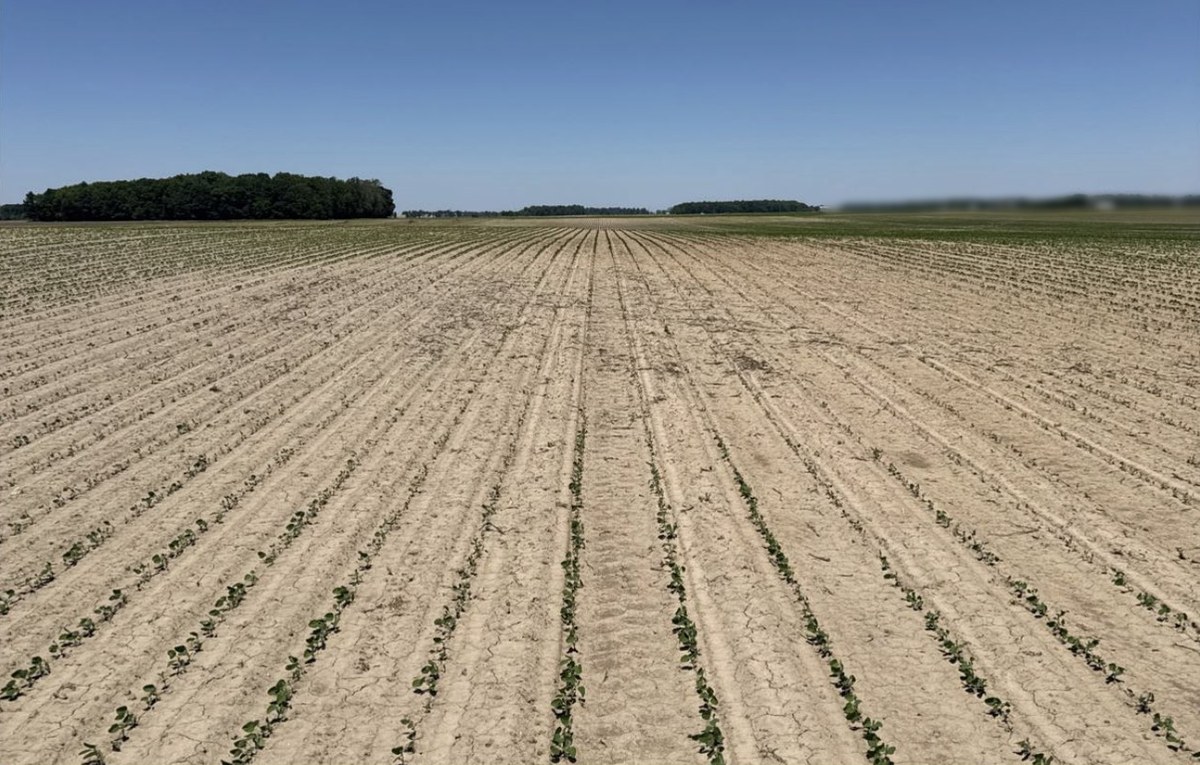

    Soybean field with sparse, uneven emergence in dry, cracked soil after a wet spring
    Thin, patchy soybean emergence after a wet, stop-and-start spring: acres headed toward near-zero yield without a replant.

    This multi-generational operation grows corn and soybeans, built around efficiency: getting the most out of every pass, every acre, and every hour. They plant early most years. And for several springs running, the weather has been wet. 2026 was no exception.

    Beans went in early. Then came heavy rain, a stretch of hot weather, and more rain. By the time conditions cooperated, emergence was thin and patchy across several fields, and the window to replant was narrow. Without action, some of those acres were headed toward near-zero yield.

    Three replant questions, one tight window

    With several fields hit by the same weather, the team needed fast answers to three questions:

    1. Where do we go first?
    2. How much seed do we order?
    3. Which fields and pockets are the priority?

    Guess wrong in a tight window, and you burn time driving to the wrong fields, or run short on seed where it matters most.

    Ground truth first, then AI

    This was the operation’s second season on AGMRI, and they started where good agronomy always starts: on the ground.

    The team visited one affected field to build a baseline. They dropped scouting pins and confirmed what the AGMRI imagery showed, so the map patterns matched what was happening in the dirt. Once they knew what a problem pocket looked like in the AGMRI, they could find that same signature across the other affected fields without walking every acre.

    Then they gave the scouting and analytics results to the AGMRI AI agent and asked it to generate a replant prescription. After a couple of iterations, they had an acre-level, variable-rate Rx map. It ranked which pockets to replant across a handful of fields and sized the seed order to match.

    Diagnose, build the Rx, refine: all of it happened on June 2. The grower replanted the fields on June 3.
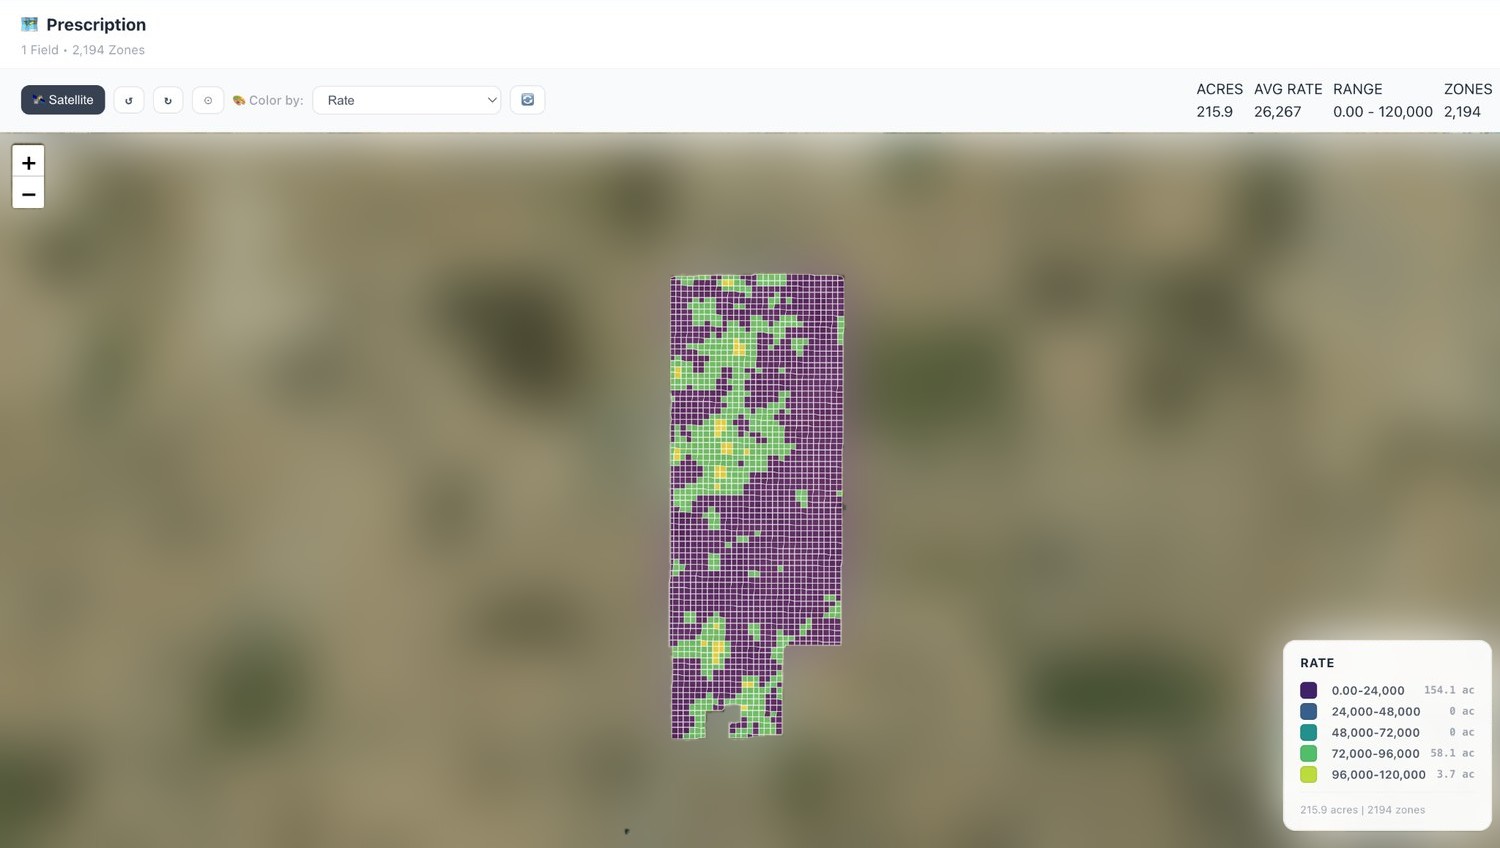

    AGMRI variable-rate soybean replant prescription map showing ranked replant pockets across one field
    The AI-built replant prescription: an acre-level, variable-rate Rx map that ranked which pockets to replant and sized the seed order.

    The results

    On one 219-acre field, the plan let the grower spot-replant roughly 60 acres that otherwise would have produced almost nothing.

    • About 60 acres recovered: moved from a projected 0 bu/ac toward a forecast of 60+ bu/ac
    • +16.4 bu/ac: the forecast lift across the whole 219-acre field
    • About $160/ac: recovered opportunity across the field, before input cost

    Just as important in a compressed window, the Rx map let the crew work the right acres in the right order and order the right amount of seed, instead of reacting field by field.

    What I take from this

    The technology didn’t make the call. The grower and the crew did, starting with boots in the field. AGMRI took what they confirmed on the ground and scaled it across every affected acre, fast enough to matter. That’s the job AGMRI is built to do: help good people make good decisions faster.


    Download the PDF

    Related use case: How Early Tar Spot Detection Turned a Wait-and-See Fungicide Call Into a Targeted Plan

    Frequently Asked Questions

    What is a spot replant Rx map?

    It’s a variable-rate prescription that targets only the pockets of a field that need replanting, rather than the whole field. It also tells you how much seed you need.

    How does AGMRI help with soybean replant decisions?

    AGMRI imagery and analytics show emergence problems across fields. Once a team confirms on the ground what a problem pocket looks like, the AGMRI AI agent can help build a replant Rx map that ranks pockets and sizes the seed order.

    Does this replace scouting?

    No. In this case, scouting came first. Ground truth calibrated what the imagery was showing, and the platform extended that knowledge across fields.

    How fast can a replant plan come together?

    For this operation, the diagnosis, Rx map and refinements were done in one day, and replanting happened the next.

    Get your next replant plan in a day

    Contact sales@intelinair.com
    Learn more at intelinair.com

    Demitrius Kikalos is Sales Leader for Intelinair.
  • The Season Review That Turns Into Next Season’s Plan: Inside the AGMRI LookBack Report

    The Season Review That Turns Into Next Season’s Plan: Inside the AGMRI LookBack Report

    Published: October 8, 2026

    By: Conner Schmidt

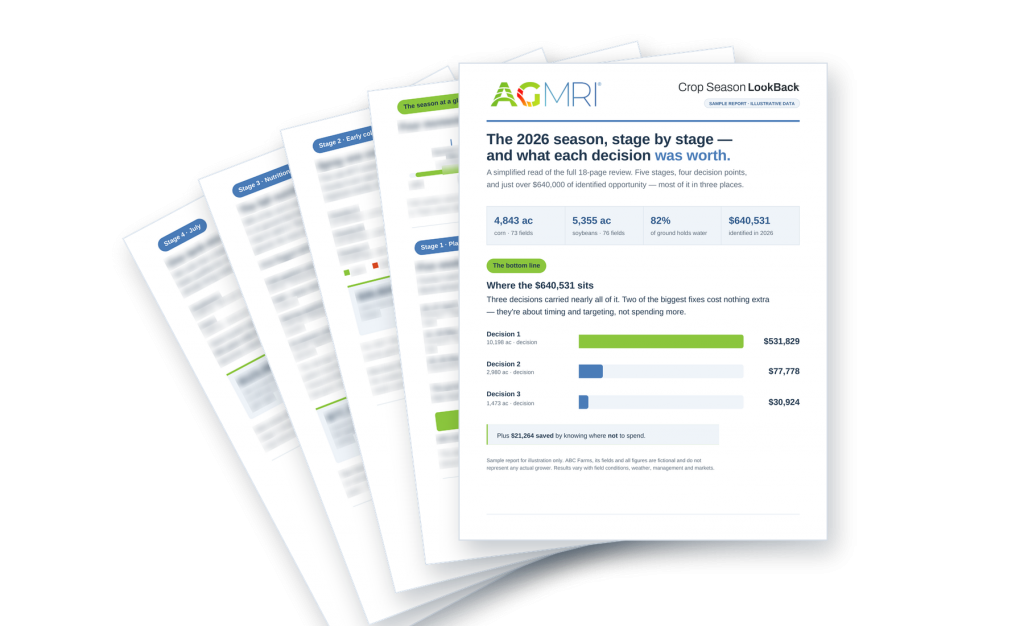
    The AGMRI LookBack Report now does more than review a season. It maps every in-season decision and turns the findings into next year’s plan.

    A season review used to mean a yield map and a conversation. Good ground, bad ground, a few guesses about why. The AGMRI LookBack Report was built to do more than that: walk a season in order (planting, hybrid response, nutrition, mid-season, harvest) and put a number on what each decision was worth. That’s still true. What’s new is what happens after the review is read.

    The LookBack Report has grown from a static account of the season into an interactive workspace that a grower and their trusted advisor can work through together, field by field, and carry directly into next year’s plan. That’s a meaningful step up in what a season review can do for grower-level management decision-making, and it’s an expanded capability for Intelinair.

    A season, read in order, not just at the end

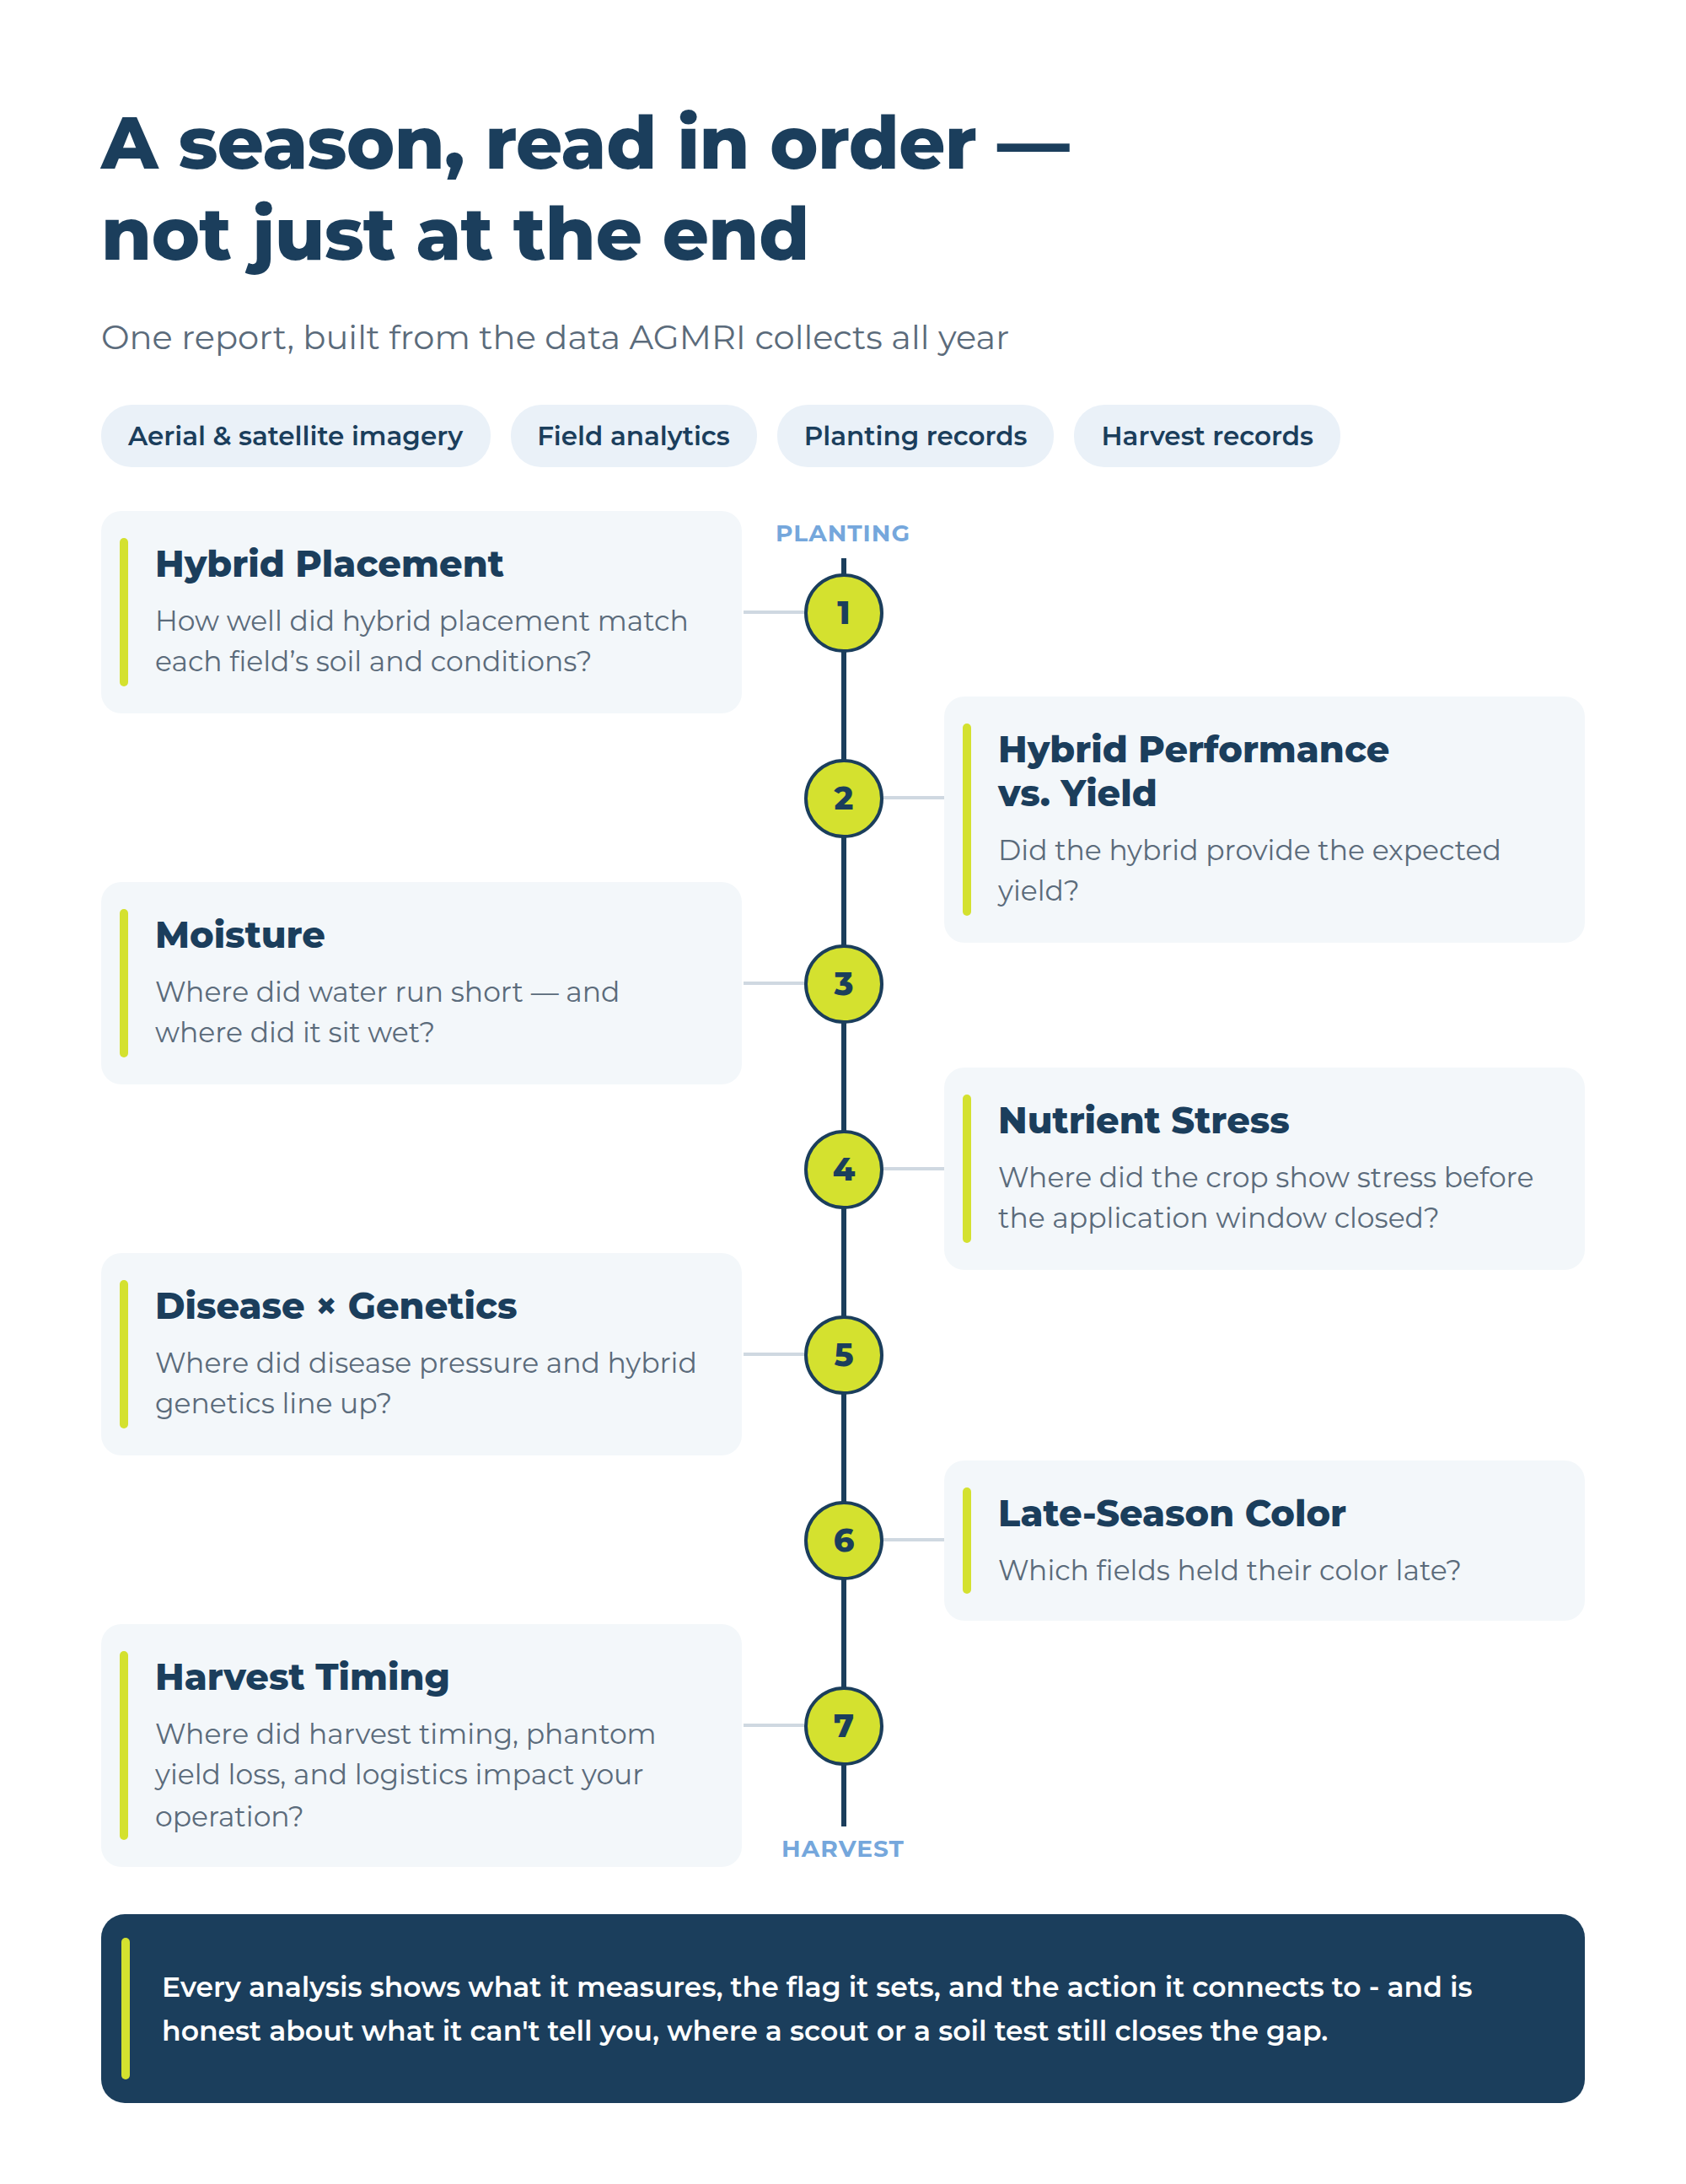
    The report is built from your farm’s AGMRI’s season-long aerial and satellite imagery and field analytics, alongside the planting and harvest records that give them context. Rather than compress all of that into one number, it’s organized into a set of focused analyses that each answer one question about the season:

    • overall hybrid performance across the operation
    • how well hybrid placement matched each field’s soil and conditions
    • where moisture ran short or sat wet
    • where the crop showed nutrient stress before a pass closed
    • where disease pressure and hybrid genetics lined up
    • which fields held their color late, and
    • where harvest timing, phantom yield loss, and logistics impact your operation

    Seven-step AGMRI season timeline from planting to harvest: hybrid placement, hybrid performance vs. yield, moisture, nutrient stress, disease × genetics, late-season color, harvest timing.
    Seven questions, asked in the order the season asks them; each one flagged while there’s still time to act on it, or captured for next year’s plan.

    Each analysis is transparent about its own limits, showing:

    • what it measures
    • what flag it sets
    • how that flag connects to an action

    That discipline is what makes the report usable for management decisions.

    Hybrids and varieties, graded on this operation’s soil

    The report rolls up performance by genetics: how each hybrid or variety performed on wet ground, dry ground, and under disease pressure, and where it ran ahead of or behind the farm average. What it did on this farm’s stressed acres this season either confirms its placement or flags it for a second look in the next seed decision.

    Every application, every field, on one timeline

    Underneath the season-level view is a field-by-field timeline of in-season applications. That timeline turns “what did we spray and why” into a tool growers use to manage decisions: which fields carried which pass, what the data said at the time, and whether the outcome and ROI matched the call.

    A companion field map does the same thing spatially: color the whole operation by yield against the farm average, by hybrid, by disease rating, or by bushels lost to harvest timing, then click into any single field for the underlying detail. Seeing the season on a timeline and on a map, side by side with the numbers, is what makes cause and effect legible instead of anecdotal.

    The bigger capability: the review builds the plan

    The biggest addition is this: the LookBack Report explains what happened and carries those findings straight into a plan for the next season, such as seed and hybrid placement, nitrogen timing, fertilizer, herbicide and fungicide programs, and harvest timing, with the cost and expected revenue of each recommended change. A grower and their advisor can see not just that a change is recommended, but what it costs, what it’s worth, and how that compares to staying the course.

    The LookBack Report closes the loop a static report never could. The plan starts with the evidence, and every recommendation is traceable back to the flag, the field, and the data behind it.

    Built for the conversation, not just the file

    The LookBack Report is designed to be used with a trusted advisor. Findings stay labeled for what they are, measured on this farm’s own fields, or modeled from trial-based responses applied to this operation’s conditions. That way, the conversation about next season starts from what the data can actually support, and what it can’t.

    That’s the point of the capability: put field-documented evidence behind the decisions a grower and their advisor are already weighing, in a form that walks from “here’s what the season did” to “here’s what to do about it” without losing the thread in between.

    Frequently asked questions

    What is the AGMRI LookBack Report?

    An interactive season review built on a full season of AGMRI imagery and field analytics from your farm that shows how each hybrid performed and what each in-season decision was worth and carries those findings into a priced plan for the following season.

    How is it different from a yield map or a standard season summary?

    A yield map shows the outcome. The LookBack Report reconstructs the causes behind it stage by stage: hybrid performance, water and nutrient stress, disease pressure and genetics, harvest timing, and turns each into a specific, dated flag connected to an action, rather than a single end-of-season number.

    How does the report evaluate hybrid performance?

    It compares how each hybrid or variety performed on wet ground, dry ground, and under disease pressure across this operation’s fields. Then it flags where placement should be confirmed or revisited in next year’s seed plan.

    What’s new compared to earlier versions of the report?

    The report is now an interactive workspace rather than a static document: a season-long analytics view, a field-and-application timeline, an interactive whole-farm map, a hybrid and variety performance rollup, and the biggest addition: a planning view that turns the season’s findings directly into a plan for next year.

    Are the findings measured or modeled?

    Both, and each is labeled as such throughout the report. Measured findings compare matched groups of the operation’s own fields; modeled findings apply trial-based responses to this operation’s documented field conditions. The report is explicit about which is which, and where the data isn’t strong enough to support a number.

    Who is the report meant to be used with?

    It’s built for a grower and their trusted advisor to review together, walking the season field by field and turning the findings into next year’s plan in the same conversation, rather than handing over a report to be read alone.

    Can the report help decide where not to spend, not just where to spend?

    Yes. Because every recommendation in the plan carries its own cost and expected return, it can show that a pass isn’t worth making on a given set of acres as well as it can recommend one.

    See what your season can tell you

    To learn more about AGMRI and the LookBack Report, request a demo at intelinair.com or contact us at sales@intelinair.com.

    Conner Schmidt is the Commercial Lead for Intelinair.

  • Use Case: How Early Tar Spot Detection Turned a Wait-and-See Fungicide Call Into a Targeted Plan

    Use Case: How Early Tar Spot Detection Turned a Wait-and-See Fungicide Call Into a Targeted Plan

    Published: September 30, 2026

    By: Blake Retherford

    For growers on a two-pass fungicide program, the season’s hardest call is often the second: spray now, or wait until you see disease? In 2026, one Indiana corn grower answered that question with data from his own fields and treated four of his six fields at V8, well ahead of tar spot.

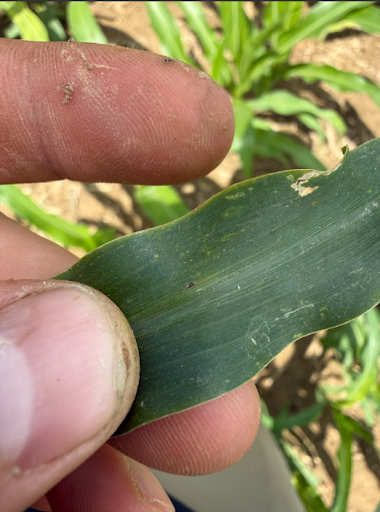
    Close-up of a corn leaf with a small early tar spot lesion, the first visible sign of the disease confirmed in the grower's field.
    An early tar spot lesion in the field: small and easy to miss on a single leaf, the ground truth that confirmed risk had become reality.

    The situation: a skipped V5 pass and an unusual weather year

    This grower skipped a V5 fungicide application this season. His V5 Fungicide Opportunity Report in AGMRI flagged that decision as worth a second look. It showed more than $12,800 in potential return across his fields if he treated the right acres.

    Tar spot is a recurring concern in his region. Like many two-pass growers, he wanted to wait for visible disease pressure before committing fungicide dollars. But 2026 weather was anything but ordinary, and those conditions can speed disease spread once it takes hold.

    The challenge: tar spot is hard to catch early

    With higher input prices, blanket fungicide applications can be inefficient. Even with a V5 report showing strong ROI potential, this grower wanted his decision grounded in current disease pressure, not a spreadsheet alone.

    That is a familiar bind. Tar spot’s first signs are tiny lesions that are easy to miss in the canopy. Once that first lesion shows up, the weather dictates how fast it spreads. In an unusual year, waiting for confirmation can mean acting too late and leaving yield on the table across multiple fields.

    The solution: whether, when, and where

    Predictive Disease answered whether and when. AGMRI’s Predictive Disease found tar spot in one of his fields about a week after Indiana’s first confirmed case of the season, and before any confirmed case in his county. The field card showed the risk level and a defined action window before disease was visible across the field.

    AGMRI Predictive Disease field card for the flagged corn field, showing tar spot risk level and a defined action window before disease was visible across the field.
    The Predictive Disease field card for the flagged field showed the risk level and a defined action window, pointing to a decision before disease was visible.

    That changed the decision. Instead of waiting for tassel, he made a fungicide pass at V8. It was earlier than usual for him, but the risk in his own fields clearly warranted it.

    The V5 Fungicide Opportunity Report answered where. His highest-opportunity field, at the top of the report’s ranked list, was the same field where tar spot had turned up. Using that ranking, he treated the top four of his six fields, concentrating the pass on the acres with the most return potential instead of treating everything or guessing.

    AGMRI V5 Fungicide Opportunity Report ranking the grower's six corn fields by fungicide return potential, with the tar spot field at the top of the list.
    The V5 Fungicide Opportunity Report, with the flagged field at the top of the ranked list, used to decide which fields to treat.

    The results

    • $12,800+ in ranked return potential targeted with his fungicide dollars
    • 4 of 6 fields treated, prioritized by ROI
    • V8 application, ahead of tassel, based on predicted risk

    By pairing early detection with field-level ROI ranking, he acted ahead of the disease instead of chasing it, and prioritized the right fields during a busy stretch.

    What this means for your 2027 fungicide plan

    The grower made the call. AGMRI gave him field-level evidence to make that call with confidence. Looking ahead, he plans to lean on AGMRI to time and target future passes, so the V5 decision is data-backed from the start.


    Download the PDF

    Frequently Asked Questions

    How does AGMRI help with tar spot?

    AGMRI Predictive Disease flags field-level disease risk and an action window, which can help growers and agronomists catch tar spot before it is widespread in the canopy.

    What is the V5 Fungicide Opportunity Report?

    It is an AGMRI report that estimates fungicide return potential and ranks fields, so growers can decide which acres to treat first.

    Can I use AGMRI on a two-pass fungicide program?

    Yes. In this 2026 use case, a two-pass grower used Predictive Disease to time his second pass at V8 and the V5 report to choose which four of six fields to treat.

    Know where fungicide pays before you spray

    Contact sales@intelinair.com
    Learn more at intelinair.com

    Blake Retherford is a Territory Account Manager for Intelinair.